Profit
Overall financial results
Within the Profit dimension of DSM's Triple P approach, DSM aims to deliver a sustainable financial return. This ensures business continuity and allows the company to grow, while at the same time providing shareholders the opportunity to invest in a company whose purpose drives sustainable above-market growth at higher returns.
We established and implemented our three-year strategic plan for the period 2016-2018 called Strategy 2018: Driving Profitable Growth with two headline financial targets: high single-digit percentage annual Adjusted EBITDA growth and high double-digit basis point annual ROCE growth. To deliver on these targets, we defined clear actions, including outpacing market growth, cost reduction and efficiency improvements to deliver €250–300 million in cost savings versus the 2014 baseline, and making a continuous push for consistent improvements in capital efficiency.
In support of our targets, we also adjusted our global organizational and operating model to create a more agile, commercially focused and cost-efficient company. We refrained from large acquisitions and focused instead on delivering value from the current portfolio and extracting value from the monetization of our joint venture partnerships.
This chapter includes an overview of the key financial metrics of the company and our performance in 2018.
In 2018, DSM delivered strong financial results again as we significantly exceeded our financial targets. Our focus on driving above-market sales growth, while pursuing cost and efficiency improvement initiatives as well as maintaining capital discipline, continued to deliver strong results in both Nutrition and Materials.
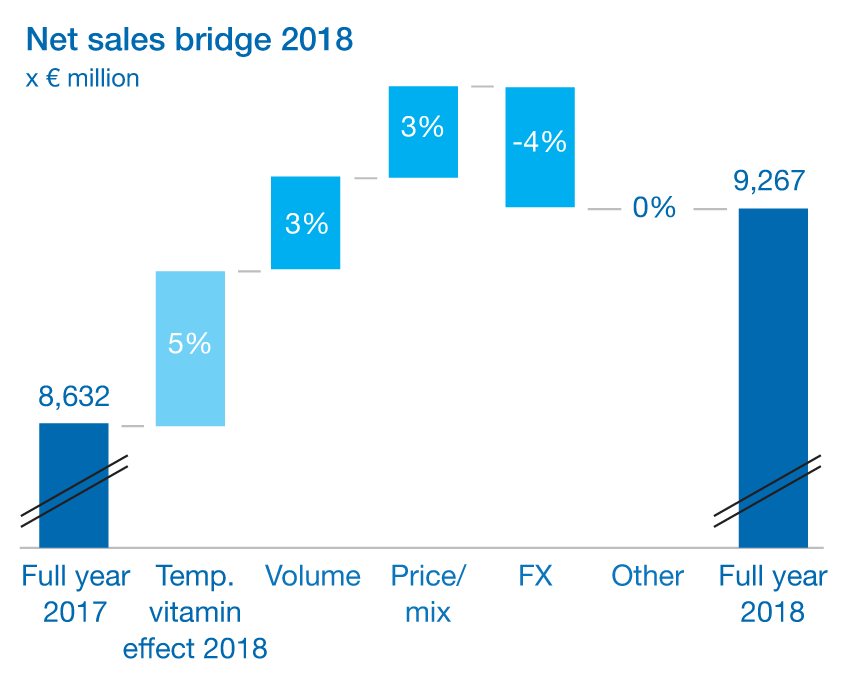
In Nutrition, we benefitted from a temporary vitamin effect caused by an exceptional supply disruption in the industry. Adjusted for the total estimated temporary vitamin effect of €415 million, our underlying organic growth was 6% compared to 2017, with sales of €8,852 million. Volumes were up 3% from the previous year and above market growth. The price growth of 3% was partly offset by a negative foreign currency impact. The Adjusted EBITDA in the underlying business was up 6% from 2017, to €1,532 million. Adjusted for currencies, the growth was 10%, above the high single-digit growth target set with Strategy 2018. Strong EBITDA growth in the business was also supported by our cost-reduction and efficiency improvement programs.
DSM achieved run-rate cumulative gross cost savings of about €275 million by the end of 2018. In the underlying business, Return on Capital Employed (ROCE) was up 100 basis point to 13.3%. Since the kick-off our successful
Strategy 2018, ROCE is up 570 basis points versus end of 2015 (in the underlying business).
Our total sales increased by 7%, to €9,267 billion (compared to €8,632 in 2017), including a total estimated €415 million temporary vitamin effect. The total Adjusted EBITDA was up 26% to €1,822 million, benefiting from a total estimated €290 million temporary vitamin effect. Our total ROCE was 16.8%, up 450 basis points from 12.3% in 2017. Since the launch of our successful Strategy 2018, our total ROCE was up 920 basis points.
Income statement
|
x € million
|
2018
|
2017
|
Change
|
|
Net sales underlying business1
|
8,852
|
8,632
|
2%
|
|
Net sales
|
9,267
|
8,632
|
7%
|
|
Adjusted EBITDA underlying business1
|
1,532
|
1,445
|
6%
|
|
Adjusted EBITDA
|
1,822
|
1,445
|
26%
|
|
EBITDA
|
1,754
|
1,348
|
30%
|
|
Adjusted operating profit
|
1,345
|
957
|
41%
|
|
Operating profit
|
1,245
|
846
|
47%
|
|
Adjusted net profit
|
1,034
|
706
|
46%
|
|
APM adjustments
|
45
|
1,075
|
|
|
Net profit
|
1,079
|
1,781
|
(39%)
|
|
Net profit attributable to equity holders of Koninklijke DSM N.V.
|
1,077
|
1,769
|
(39%)
|
|
ROCE underlying business (in %)1
|
13.3
|
12.3
|
|
|
ROCE (in %)
|
16.8
|
12.3
|
|
|
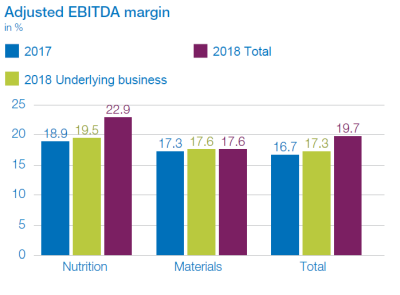
Adjusted EBITDA margin underlying business
(in %)1 |
17.3
|
16.7
|
|
|
Adjusted EBITDA margin (in %)1
|
19.7
|
16.7
|
1 Excluding temporary vitamin effect, see Key business figures at a glance.
Capital efficiency is a key driver of cash generation. One of our key focus areas continued to be the improvement in our working capital as percentage of total sales. At the end of 2018, total working capital was € 1,674 million, compared to €1,499 in 2017. The average total working capital as a percentage of sales was 18.7%, compared to 18.4% in 2017, partly due to the temporary vitamin effect in Nutrition during 2018 and in line with our aspiration of 'below 20%'.
Innovation plays an important role in driving both top-line and bottom-line growth. With 19% innovation sales in 2018 (in the underlying business), which we define as sales from products and solutions introduced in the last five years, we are delivering against our ambitious aspiration of 20%. In 2018, DSM also made progress on promising innovation projects that could have a wider societal impact and drive future growth. These include the Project Clean Cow, Veramaris®, fermentative Stevia and Niaga®.
During 2018, DSM also extracted value with the sale of the stake in DSM Sinochem Pharmaceuticals to Bain Capital. DSM received €271 million in cash following closing, excluding an earn-out. Furthermore, DSM anticipates receiving about €200 million in cash relating to the divestment of the Fibrant business by its associate ChemicaInvest (of which €120 million was received in 2018). During the strategic period, we extracted significant value from our joint venture partnerships Patheon, ChemicaInvest and DSM Sinochem Pharmaceuticals. The combined proceeds of these divestments were around €3 billion.
Net sales and Adjusted EBITDA
Excluding the exceptional temporary vitamin effect influencing the Nutrition business (mainly in Animal nutrition), organic growth in the underlying business was 6%, driven by both Nutrition and Materials. Volume development accounted for a 3% increase, while price/mix had an 3% positive effect on growth compared to 2017. Exchange rate fluctuations had a negative impact of 4%. At €9,267 million, total net sales in 2018 were 7% higher than in 2017 (€8,632 million), with organic growth up by 11%.
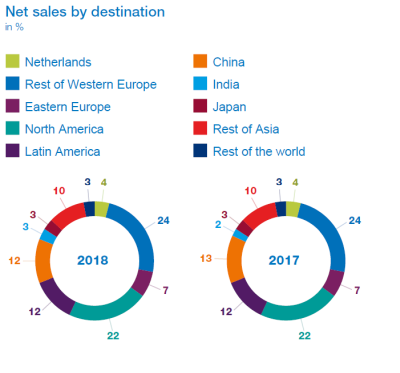
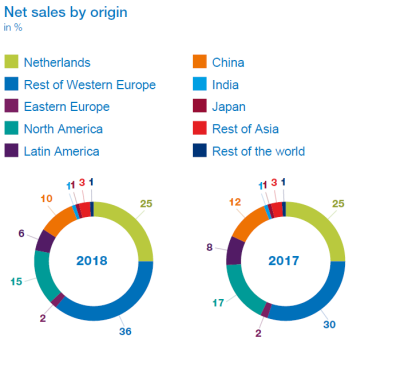
Sales growth was strong among all regions, with favorable high double-digit growth in Western Europe and single-digit growth in North and Latin America. Sales were good in Latin America and China, despite some temporary shutdowns in Brazil and against a backdrop of economic uncertainty in both regions.
Solid growth was achieved in China, India and Eastern Europe. All high-growth economies together currently represent 43% of DSM's sales in the underlying business (44% when Africa is included), which is in line with 2017. The share of sales in these economies as a proportion of DSM's total sales gives us a well-balanced global footprint.
The Adjusted EBITDA in the underlying business was 6% up compared to the prior year to €1,532 million in 2018. Total Adjusted EBITDA (Adjusted operating profit before depreciation and amortization) increased by 26% or €377 million, from €1,445 million in 2017 to €1,822 million in 2018.
Adjusted EBIT (Adjusted operating profit) rose from €957 million in 2017 to €1,345 million in 2018, up 41%.
|
Net sales
|
Adjusted EBITDA
|
||||||
|
x € million
|
2018
|
2017
|
% change
|
2018
|
2017
|
% change
|
|
|
DSM underlying business1
|
8,852
|
8,632
|
2%
|
1,532
|
1,445
|
6%
|
|
|
DSM
|
9,267
|
8,632
|
7%
|
1,822
|
1,445
|
26%
|
|
|
Nutrition underlying business1
|
5,722
|
5,579
|
3%
|
1,117
|
1,053
|
6%
|
|
|
Nutrition
|
6,137
|
5,579
|
10%
|
1,407
|
1,053
|
34%
|
|
|
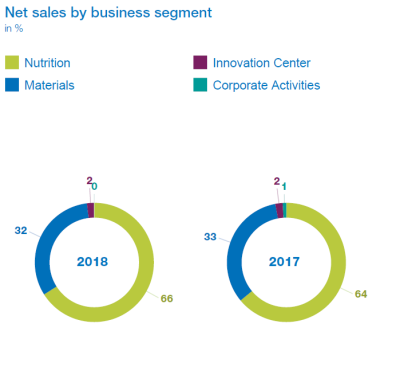
Materials
|
2,913
|
2,825
|
3%
|
512
|
488
|
5%
|
|
|
Innovation Center
|
172
|
169
|
2%
|
8
|
9
|
||
|
Corporate Activities
|
45
|
59
|
(105)
|
(105)
|
|||
1 Excluding temporary vitamin effect, see Key business figures at a glance.
Net profit
Net profit attributable to equity holders of DSM decreased by €692 million to €1,077 million. This decrease was mainly a result of the higher Adjusted EBITDA (up €377 million, including temporary vitamin effect), the sale of DSM's share in Patheon in 2017 (down €1,250 million) and other differences in APM adjustments (up €220 million), see below. Expressed per ordinary share, net earnings (including temporary vitamin effect) amounted to €6.10 in 2018 (2017: €10.07).
Financial income and expense decreased by €3 million year over year to €101 million. Lower interest expenses were offset by lower results on derivatives.
The reported effective tax rate over Adjusted taxable result 2018 was 17.4% (2017: 16.8%). This increase was mainly caused by the one-off positive effect by the change in US tax rate in 2017.
Adjustments made in arriving at DSM's Alternative performance measures (APM adjustments)
Total APM adjustments for the full year amounted to a profit of €45 million, consisting of a profit regarding associates and joint ventures of €122 million (mainly due to the gain of €109 million on the sale of the shares of DSM Sinochem Pharmaceuticals), offset by €68 million in restructuring costs related to the ongoing cost-reduction programs, €32 million of impairments and a related tax benefit of €23 million.
Cash flow statement
|
x € million
|
2018
|
2017
|
|
Cash and cash equivalents at 1 January
|
899
|
604
|
|
Cash flow provided by operating activities
|
1,391
|
996
|
|
Cash from / (used in) investing activities
|
(605)
|
689
|
|
Cash from / (used in) financing activities
|
(401)
|
(1,344)
|
|
Effect of exchange differences
|
(3)
|
(46)
|
|
Cash and cash equivalents at 31 December
|
1,281
|
899
|
Cash flow provided by operating activities consists of the EBITDA for the year (€1,754 million) less various cash-out items including income tax of €107 million and change in provisions of €41 million, and changes in working capital of €238 million. Our focus on cash flow resulted in a full-year operating cash flow of €1,391 million, which is 40% higher than 2017, mainly due to the increase in EBITDA. Corrected for the temporary vitamin effect, the cash from operating activities amounted to €1,126 million, an increase of 13%. See also Consolidated financial statements.
The cash used in investing activities included capital expenditures (€673 million) and additions to fixed term deposits (€322 million), partly offset by the sale of the shares in DSM Sinochem Pharmaceuticals (€271 million) and the repayment of loans granted to ChemicaInvest (€163 million).
The cash used in financing activities consisted mainly of dividend paid (€225 million) and repurchase of shares (€236 million).
For the full cash flow statement, see Consolidated financial statements.
Balance sheet
The balance sheet total (total assets) reached €13.6 billion at year-end (2017: €12.8 billion). Equity increased by €750 million compared to the position at the end of 2017. This increase was mainly due to the net result of 2018. Equity as a percentage of total assets increased from 55% to 57%.
Compared to year-end 2017, net debt decreased by €629 million to €113 million. The gearing at year-end was 1.4%, a further decrease compared to 9.5% at year-end 2017.
Capital expenditure on intangible assets and property, plant and equipment amounted to €653 million in 2018 (€646 million on a cash basis), which was 37% higher than the level of amortization and depreciation in support of the high organic growth.
Total working capital amounted to €1,674 million compared to €1,499 million at year-end 2017, which represents 19.0% as a percentage of annualized fourth quarter 2018 sales (2017: 17.2%), below our aspiration of 20%. Cash-wise, the operating working capital (OWC) increased by €246 million, mainly related to organic growth. OWC percentage increased from 22.3% at year-end 2017 to 24.2% of annualized sales at year-end 2018.
Cash and cash equivalents came to €1,281 million at the end of the year; including current investments, this amounted to €2,558 million (2017: €1,853 million). Besides the regular cash flow, this increase was mainly attributable to the sale of our share in DSM Sinochem Pharmaceuticals and the repayment of the loans granted to ChemicaInvest.
Balance sheet profile
|
2018
|
2017
|
|||
|
x € million
|
in %
|
x € million
|
in %
|
|
|
Intangible assets
|
3,090
|
23
|
3,058
|
24
|
|
Property, plant and equipment
|
3,511
|
26
|
3,313
|
26
|
|
Other non-current assets
|
730
|
5
|
999
|
8
|
|
Cash and cash equivalents
|
1,281
|
9
|
899
|
7
|
|
Other current assets
|
5,029
|
37
|
4,533
|
35
|
|
Total assets
|
13,641
|
100
|
12,802
|
100
|
|
Equity
|
7,815
|
57
|
7,065
|
55
|
|
Provisions
|
153
|
1
|
204
|
2
|
|
Other non-current liabilities
|
3,139
|
23
|
3,358
|
26
|
|
Other current liabilities
|
2,534
|
19
|
2,175
|
17
|
|
Total equity and liabilities
|
13,641
|
100
|
12,802
|
100
|

By optimizing our cost structure and improving our earnings growth rate, we have significantly strengthened our financial performance. With a strong balance sheet, we have the high level of financial flexibility to deliver our ambitious growth plans.
Geraldine Matchett, CFO
Outlook 2019
DSM expects to deliver a full-year 2019 mid-to-high single digit increase in Adjusted EBITDA compared to prior year underlying Adjusted EBITDA (excluding temporary vitamin effect), together with an improvement in underlying Adjusted Net Operating Free Cash Flow in line with its Strategy 2021 targets. This outlook excludes the impact of IFRS16.