Our purpose is to create brighter lives for all. We use our bright science to create solutions for people today and generations to come.

Message from our CEO

For DSM 2018 was a very successful year in almost every way. The hard work and engagement of our employees delivered very strong results of which we can all be justly proud. Financially, we delivered well ahead of our strategic targets, creating significant value in all our businesses. In sustainability we outperformed our aspirations. Although our safety performance needs to further improve, our people feel more inspired, engaged and committed than ever. We are well placed to move forward and to deliver on our 2021 strategic targets, to drive continued above-market organic growth and deliver further improvements in profitability, returns and sustainability.

Read Feike Sijbesma's letter

People

  • Workforce

    20,977

    ~23,0001

    at year end 2018,
    excluding affiliates
  • Engagement

    76%
    Employee Engagement Index
    versus 75% in 2017
  • Gender ratio

    28/722
    Female/male ratio
    versus 27/73 in 2017
  • Female executives

    19%3
    Female executives,
    versus 17% in 2017
  • Safety

    0.33
    Frequency Index of Recordable
    Injuries versus 0.36 in 2017
    (per 100 DSM employees
    and contractors)
1 At year-end 2018, including affiliates.
2 The companies that are not integrated into the HR systems (approx. 2% of the total workforce) are not taken into account.
3 Going into 2019, the percentage of women in our Executive Committee and Supervisory Board is 43%.

Planet

  • Greenhouse gas

    33%
    Greenhouse gas efficiency
    improvement versus 2008,
    versus 26% in 2017
  • Electricity

    41%
    Purchased electricity
    form renewable sources
    versus 21% in 2017
  • Innovation sales

    19%1
    Innovation sales,
    in line with our
    ambition of ~20%
  • Energy efficiency

    5.1%
    Energy efficiency improvement,
    versus 2015, compared to 3.8%2 in 2017,
    >1% average annual ambition
  • Water consumption

    22
    Water consumption,
    down from 23 in 2017
    (in million m3)
2 The 2017 number has been adjusted positively because of improved data quality.

Profit

  • Net sales

    € 8,8521

    € 9,267

    Net sales versus
    € 8,632 in 2017 (in millions)
  • Adjusted EBITDA

    € 1,5321

    € 1,822

    Adjusted EBITDA2
    versus € 1,445 in 2017
    (in millions)
  • Adjusted EBITDA growth

    +6%1

    +26%

    Adjusted EBITDA2 growth
    versus 2017
  • ROCE

    13.3%1

    16.8%

    ROCE versus
    12.3% in 2017
  • ROCE growth

    +1001

    +450

    ROCE growth (in bps)
    versus 2017,
    to 13.3%1 / 16.8%
  • Cash provided

    € 1,1261

    € 1,391

    Cash provided by operating
    activities versus € 996
    in 2017 (in millions)
  • Net debt

    € 113
    Net debt versus € 742
    end of 2017 (in millions)
  • Net profit

    € 1,079
    Total net profit
    (in millions)
  • Net earnings

    € 6.103
    Net earnings per ordinary
    share, versus € 10.074 in 2017
  • Proposed dividend

    € 2.30
    Proposed dividend per
    ordinary share5 for 2018
    versus € 1.85 for 2017
4 Including gain of € 1,250 million on Patheon disposal.
5 Subject to approval by the Annual General Meeting of Shareholders.

Brighter Living Solutions

  • Sales of Brighter Living Solutions

    62%1, 2
    Sales of Brighter Living Solutions
    versus 62% in 2017.
2 For a small percentage of sales (approximately 2% of sales) classified as BLS, the environmental impact is considered 'best in class' together with other solutions.

View the full key data table

DSM around the world
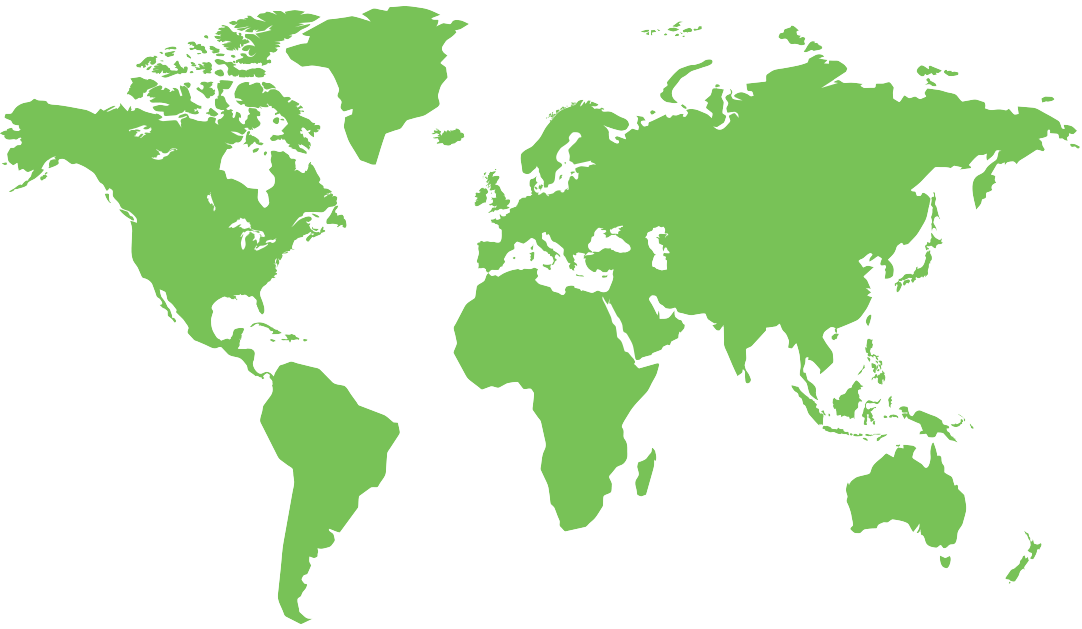
Netherlands

Net sales by origin

2,299 million | 25 %

Net sales by destination

405 million | 4 %

Workforce

3,827 (headcount)

North America

Net sales by origin

1,403 million | 15 %

Net sales by destination

2,070 million | 22 %

Workforce

3,281 (headcount)

Latin America

Net sales by origin

574 million | 6 %

Net sales by destination

1,081 million | 12 %

Workforce

2,214 (headcount)

Eastern Europe

Net sales by origin

195 million | 2 %

Net sales by destination

597 million | 7 %

Workforce

523 (headcount)

Rest of Western Europe

Net sales by origin

3,301 million | 36 %

Net sales by destination

2,229 million | 24 %

Workforce

5,069 (headcount)

China

Net sales by origin

938 million | 10 %

Net sales by destination

1,131 million | 12 %

Workforce

4,104 (headcount)

India

Net sales by origin

95 million | 1 %

Net sales by destination

233 million | 3 %

Workforce

556 (headcount)

Japan

Net sales by origin

113 million | 1 %

Net sales by destination

322 million | 3 %

Workforce

204 (headcount)

Rest of Asia

Net sales by origin

264 million | 3 %

Net sales by destination

906 million | 10 %

Workforce

904 (headcount)

Rest of the world

Net sales by origin

85 million | 1 %

Net sales by destination

293 million | 3 %

Workforce

295 (headcount)

DSM and the Sustainable Development Goals

Companies have a key role to play in achieving the SDGs. We believe that our combination of Health, Nutrition and Sustainable Living contributes in a positive way toward achieving the SDGs.

Find out more