Key business figures at a glance
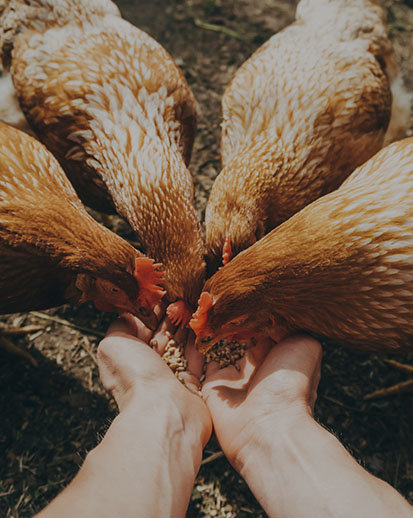
With effect from January 2022, our activities are grouped in three operating segments: Animal Nutrition & Health (ANH), Health, Nutrition & Care (HNC) and Food & Beverage (F&B). We report separately on Corporate Activities. Results presented in this section (and elsewhere in this Report) relate to consolidated activities only (therefore non-consolidated partnerships are excluded).
x € million |
|
2022 |
|
2021 |
|---|---|---|---|---|
|
|
|
|
|
Animal Nutrition & Health |
|
3,788 |
|
3,347 |
Health, Nutrition & Care |
|
2,939 |
|
2,516 |
Food & Beverage |
|
1,546 |
|
1,256 |
Other |
|
46 |
|
47 |
Total HNB |
|
8,319 |
|
7,166 |
Corporate Activities |
|
71 |
|
103 |
Total continuing operations |
|
8,390 |
|
7,269 |
|
|
|
|
|
Discontinued operations |
|
2,090 |
|
2,199 |
Total |
|
10,480 |
|
9,468 |
x € million |
|
2022 |
|
2021 |
|---|---|---|---|---|
|
|
|
|
|
Animal Nutrition & Health |
|
351 |
|
|
Health, Nutrition & Care |
|
428 |
|
|
Food & Beverage |
|
136 |
|
|
Other |
|
1 |
|
|
Total HNB |
|
916 |
|
951 |
Corporate Activities |
|
(149) |
|
(143) |
Total continuing operations |
|
767 |
|
808 |
|
|
|
|
|
Discontinued operations |
|
304 |
|
359 |
Total |
|
1,071 |
|
1,167 |
x € million |
|
2022 |
|
2021 |
|---|---|---|---|---|
|
|
|
|
|
Animal Nutrition & Health |
|
546 |
|
|
Health, Nutrition & Care |
|
676 |
|
|
Food & Beverage |
|
266 |
|
|
Other |
|
2 |
|
|
Total HNB |
|
1,490 |
|
1,467 |
Corporate Activities |
|
(95) |
|
(88) |
Total continuing operations |
|
1,395 |
|
1,379 |
|
|
|
|
|
Discontinued operations |
|
330 |
|
463 |
Total |
|
1,725 |
|
1,842 |
x € million |
|
2022 |
|
2021 |
|---|---|---|---|---|
|
|
|
|
|
HNB |
|
10,639 |
|
10,011 |
Corporate Activities |
|
21 |
|
3 |
Total continuing operations |
|
10,660 |
|
10,014 |
|
|
|
|
|
Discontinued operations |
|
813 |
|
1,005 |
Total |
|
11,473 |
|
11,019 |
in % |
|
2022 |
|
2021 |
|---|---|---|---|---|
|
|
|
|
|
Animal Nutrition & Health |
|
14.4 |
|
|
Health, Nutrition & Care |
|
23.0 |
|
|
Food & Beverage |
|
17.2 |
|
|
Total HNB |
|
17.9 |
|
20.5 |
Total continuing operations |
|
16.6 |
|
19.0 |
|
|
|
|
|
Discontinued operations |
|
15.8 |
|
21.1 |
Total |
|
16.5 |
|
19.5 |
in % |
|
2022 |
|
2021 |
|---|---|---|---|---|
|
|
|
|
|
HNB |
|
8.7 |
|
10.3 |
Total continuing operations |
|
7.3 |
|
8.7 |
|
|
|
|
|
Discontinued operations |
|
31.1 |
|
34.1 |
Total |
|
9.3 |
|
11.1 |
x € million |
|
2022 |
|
2021 |
|---|---|---|---|---|
|
|
|
|
|
HNB |
|
511 |
|
476 |
Corporate Activities |
|
61 |
|
67 |
Total continuing operations |
|
572 |
|
543 |
|
|
|
|
|
Discontinued operations |
|
64 |
|
71 |
Total, accounting based |
|
636 |
|
614 |
|
|
|
|
|
Non-cash items |
|
8 |
|
(44) |
Total, cash-based |
|
644 |
|
570 |
|
|
|
|
|
In % of net sales |
|
6.0 |
|
6.0 |
Headcount |
|
2022 |
|
2021 |
|---|---|---|---|---|
|
|
|
|
|
Continuing operations |
|
18,731 |
|
18,402 |
Discontinued operations |
|
1,951 |
|
2,956 |
Total |
|
20,682 |
|
21,358 |
|
|
x € million |
|
as % of net sales |
||||
|---|---|---|---|---|---|---|---|---|
|
|
2022 |
|
2021 |
|
2022 |
|
2021 |
|
|
|
|
|
|
|
|
|
Total continuing operations |
|
345 |
|
315 |
|
4.1 |
|
4.3 |