Our purpose is to create brighter lives for all. We use our bright science to create solutions for people today and generations to come.

CEO Message

The year 2019 was again a record year for DSM. The hard work and engagement of our employees delivered good results, in a not so easy economic, as well as (geo)political and societal, context. We can all be very proud of what has been achieved. We made decisive progress as a performance-driven and purpose-led company, creating brighter lives for all, and already reaching more than 2.5 billion people worldwide.

Read CEO letter

People

  • Workforce

    22,174
    at year end 2019,
    excluding affiliates
  • Engagement

    74%
    Employee Engagement Index,
    with a response rate of 92%,
    versus 76% in 2018
  • Gender ratio

    28:721
    Female:male ratio
    equal to 2018
  • Female executives

    20%
    Female executives
    versus 19% in 2018.
    50% of MB, EC and SB
    as of 15 February 2020
  • Safety

    0.28
    Frequency Index of Recordable
    Injuries versus 0.33 in 2018
    (per 100 DSM employees
    and contractors)
1 Excluding companies that are not integrated into our HR systems (approx. 6% of the total workforce).

Planet

  • Greenhouse gas

    ~17%
    GHG scope 1 + 2 reduction –
    cumulative structural
    improvement1 versus ~8%
    in 2018 (baseline 2016)
  • Electricity

    50%
    Purchased electricity
    form renewable sources
    versus 41% in 2018
  • Energy efficiency

    2.3%
    Energy efficiency
    improvement year on year
    versus 1.4% in 2018
1 We estimate that the effect of the underlying cumulative structural improvements in absolute GHG emissions was approximately 17% and 8% in 2019 and 2018 respectively, versus the 2016 baseline. The total cumulative absolute reduction was 25% and 18% respectively, versus the 2016 baseline.

Profit

  • Net sales

    € 9,010
    Net sales, up 2% from
    € 8,8521 in 2018 (in millions)
  • Adjusted EBITDA

    € 1,6842
    Adjusted EBITDA3
    versus € 1,5321 in 2018
    (in millions)
  • Adjusted EBITDA growth

    +10%2
    Adjusted EBITDA3 growth
    versus 20181 and versus a
    high single-digit target
  • Adjusted net operating
    free cash flow

    € 8012
    Adjusted net operating free
    cash flow3 versus € 5451 in 2018
    (in millions)
  • Adjusted net operating
    free cash flow growth

    + 47%2
    Adjusted net operating free
    cash flow3 growth versus 20181
    and versus an average annual
    target of ~10%
  • Innovation
    sales

    21%
    Innovation sales,
    in line with our
    ambition of ~20%
  • Net profit

    € 764
    Total net profit versus
    € 1,0794 in 2018 (in millions)
  • Net earnings

    € 4.27
    Net earnings per ordinary
    share, versus € 6.104 in 2018
  • Adjusted net earnings

    € 4.64
    Adjusted net earnings3
    per ordinary share,
    versus € 5.84 in 2018
  • Proposed dividend

    € 2.40
    Proposed5 dividend per
    ordinary share for 2019
    up from € 2.30 for 2018
1 Excluding temporary vitamin effect in 2018 of € 415 million sales and € 290 million (Adjusted) EBITDA, for further information see Temporary vitamin effect 2018.
2 Including the impact of IFRS 16, see Impact of IFRS 16.
3 For reconciliation to IFRS performance measures, see Alternative performance measures.
4 2018 includes the temporary vitamin effect, for further information see Temporary vitamin effect 2018, and the book profit on the sale of DSM Sinochem Pharmaceuticals.
5 Subject to approval by the Annual General Meeting of Shareholders.

Brighter Living Solutions

  • Sales of Brighter Living Solutions

    63%1
    Sales of Brighter Living Solutions
    versus 62%2 in 2018
1 For a small percentage of sales (approximately 2%) classified as BLS, the environmental impact is considered ‘best in class’ together with other solutions.
2 Excluding the temporary vitamin effect in 2018 of € 415 million sales, for further information see Temporary vitamin effect 2018.

View the full key data table

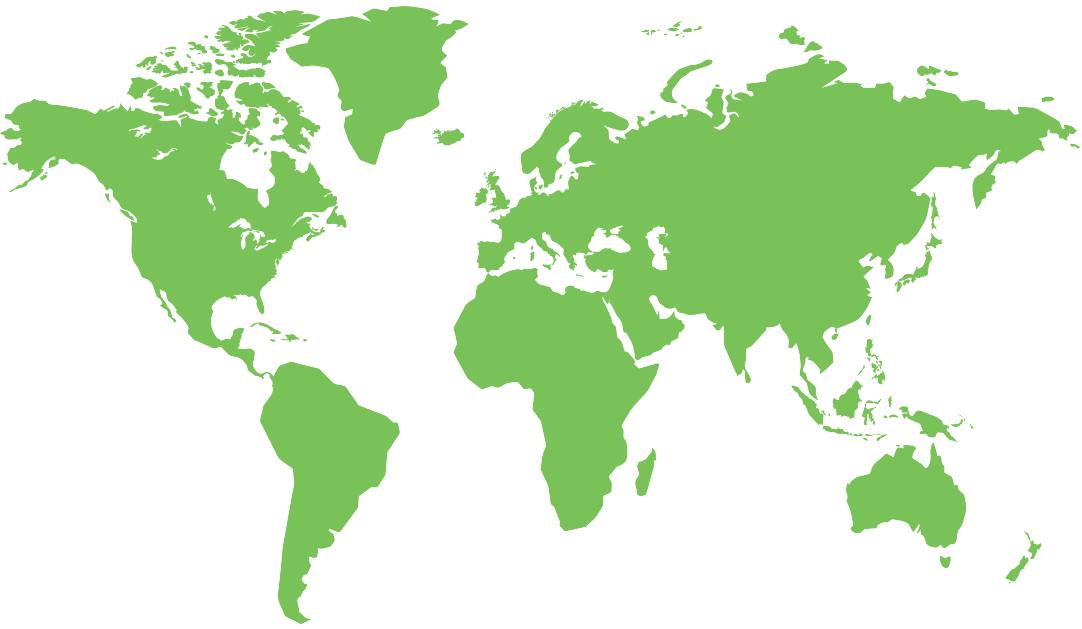
DSM around the world

Netherlands

Net sales by origin

2,173 million | 24%

Net sales by destination

351 million | 4%

Workforce

3,960 (headcount)

North America

Net sales by origin

1,568 million | 17%

Net sales by destination

2,046 million | 23%

Workforce

3,346 (headcount)

Latin America

Net sales by origin

722 million | 8%

Net sales by destination

1,116 million | 12%

Workforce

2,134 (headcount)

Eastern Europe

Net sales by origin

197 million | 2%

Net sales by destination

591 million | 7%

Workforce

575 (headcount)

Rest of Western Europe

Net sales by origin

2,667 million | 30%

Net sales by destination

2,088 million | 23%

Workforce

5,133 (headcount)

China

Net sales by origin

976 million | 11%

Net sales by destination

1,098 million | 12%

Workforce

4,959 (headcount)

India

Net sales by origin

97 million | 1%

Net sales by destination

236 million | 3%

Workforce

681 (headcount)

Japan

Net sales by origin

136 million | 2%

Net sales by destination

301 million | 3%

Workforce

205 (headcount)

Rest of Asia

Net sales by origin

370 million | 4%

Net sales by destination

898 million | 10%

Workforce

889 (headcount)

Rest of the world

Net sales by origin

104 million | 1%

Net sales by destination

285 million | 3%

Workforce

292 (headcount)

DSM and the Sustainable Development Goals

Companies have a key role to play in achieving the SDGs. We believe that our combination of Health, Nutrition and Sustainable Living contributes in a positive way toward achieving the SDGs.

Find out more