Profit
Overall financial results
In our strategic plan for the period 2019–2021, called Strategy 2021: Growth & Value - Purpose led, Performance driven, we illustrate how we will evolve further toward being a purpose-led, science-based company, operating in the fields of Nutrition, Health, and Sustainable Living. Our strong growth platform together with increased customer-centricity and large innovation projects, will drive above-market growth. Concurrently, we will continue our strong focus on cost control and operational excellence, allowing us to accelerate profit growth and cash generation. Organic growth will be complemented by acquisitions, predominantly in Nutrition given its growth potential, resilience, strong leadership position and value creation potential.
In Strategy 2021, we emphasize two headline financial targets: high single-digit annual percentage increase in Adjusted EBITDA and about 10% average annual increase in Adjusted net operating free cash flow. We also highlighted the ambitions underpinning these targets, for more information, see 'Strategy 2021'.
This chapter includes an overview of the key financial metrics of the company and our performance in 2019.
In 2019, we delivered on our financial targets with double-digit growth in Adjusted EBITDA of 10% to €1,684 million, including 3% from IFRS 16, compared to the underlying business in 2018. The strong EBITDA growth in the businesses was also supported by our continued focus on cost reduction and operational efficiency. Adjusted net operating free cash flow increased by 47% to €801 million compared to the underlying business in 2018, including 10% from IFRS 16.
Compared to the underlying business in 2018, Nutrition delivered above-market sales growth, with organic sales up 2%, and high-single digit Adjusted EBITDA growth (12%, including 3% from IFRS 16), despite challenging market conditions in some of its end-markets. Materials recorded lower volumes (down 5%), but demonstrated its earnings resilience in persisting weak market conditions with an almost stable Adjusted EBITDA (down 1%, including 1% from IFRS 16).
The Adjusted EBITDA margins were 20.7% (including 0.5% from IFRS 16) and 18.5% (including 0.2% from IFRS 16) for Nutrition and Materials respectively, both up versus the previous year in the underlying business and in line with our strategic ambitions.
Our Return On Capital Employed (ROCE) from underlying business was down 130 basis points, to 12.0% (including 30 basis points from IFRS 16), mostly driven by the impact of acquisitions and the adoption of IFRS 16.
Income statement and key data
x € million | 20191 | 2018 | Change |
Net sales underlying business | 9,010 | 8,8522 | 2% |
Net sales | 9,010 | 9,267 | -3% |
Adjusted EBITDA underlying business | 1,684 | 1,5322 | 10% |
Adjusted EBITDA | 1,684 | 1,822 | -8% |
EBITDA | 1,586 | 1,754 | -10% |
Adjusted operating profit | 1,075 | 1,345 | -20% |
Operating profit | 954 | 1,245 | -23% |
Adjusted net profit underlying business | 830 | 769 | 8% |
Adjusted net profit | 830 | 1,034 | -20% |
APM adjustments | (66) | 45 | |
Net profit | 764 | 1,079 | -29% |
Net profit attributable to equity holders of Koninklijke DSM N.V. | 758 | 1,077 | -30% |
ROCE underlying business (in %) | 12.0 | 13.32 | |
ROCE (in %) | 12.0 | 16.8 | |
Adjusted EBITDA margin underlying business | 18.7 | 17.32 | |
Adjusted EBITDA margin (in %) | 18.7 | 19.72 | |
Adjusted net operating free cash flow underlying business | 801 | 5452 | |
Adjusted net operating free cash flow | 801 | 810 |
- Including the impact of IFRS 16, see table Impact of IFRS 16.
- Excluding temporary vitamin effect in 2018 of €415 million sales and €290 million (Adjusted) EBITDA, for further information see table Temporary vitamin effect 2018.
One of our key focus areas remains the improvement in our working capital as a percentage of total sales. At the end of 2019, total working capital was €1,852 million, compared to €1,674 million in 2018. The average total working capital as a percentage of sales was 21.2%, compared to 18.7% in 2018, above our aspiration of 'below 20%', but fully driven by the consolidation of acquisitions and exchange rate effects.
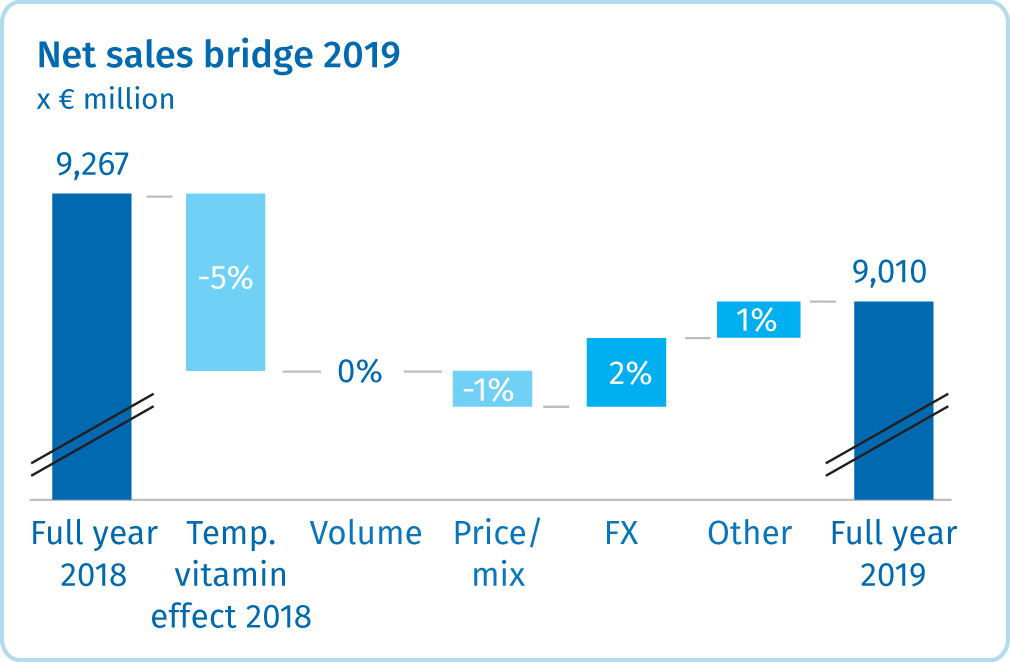
Including the estimated temporary vitamin effect of €415 million on sales driven by the exceptional supply disruption in the industry in 2018, our total sales were down 3% to €9,010 million (compared to €9,267 million in 2018).
The total Adjusted EBITDA was 8% lower at €1,684 million when considering the total estimated €290 million temporary vitamin effect of 2018. Our Total ROCE was 12.0% (including 30 basis points from IFRS 16), down 480 basis points from 16.8%.
Innovation plays an important role in driving both top-line and bottom-line growth. With 21% innovation sales in 2019, which we define as sales from products and solutions introduced in the last five years, we are delivering against our ambitious aspiration of around 20%. In 2019, we also made progress on promising innovation projects that could have a wider societal impact and drive future growth. These include our Project Clean Cow, Veramaris®, Avansya, Balancius® and Niaga®.
Net sales and Adjusted EBITDA
At €9,010 million, net sales in 2019 were 2% higher than in 2018 (€8,852 million excluding the temporary vitamin effect) or 3% lower than total sales in 2018 (€9,267 million). Underlying organic growth in 2019 was down by 1% (including the temporary vitamin effect in 2018, total organic growth was down by 5%). Volume development was rather stable, while price/mix had a 1% negative effect on growth compared to underlying sales in 2018. Exchange rate fluctuations had a positive impact of 2%, and acquisitions contributed another 1% to sales.
Total sales in 2019 were €257 million lower, mainly due to the temporary vitamin effect in 2018. Growth was achieved in LATAM and India. All high-growth economies together currently represent 43% of our sales (45% when Africa is included), which is in line with 2018. The share of sales in these economies as a proportion of our total sales gives us a well-balanced global footprint.
The Adjusted EBITDA (Adjusted operating profit before depreciation and amortization) increased by 10% or €152 million, from €1,532 million in 2018 (excluding the temporary vitamin effect) to €1,684 million in 2019. Part of the increase is the impact of IFRS 16 of €52 million. Including the temporary vitamin effect, the Adjusted EBITDA decreased by €138 million. Adjusted EBIT (Adjusted operating profit) rose from €1,055 million in 2018 (excluding the temporary vitamin effect) to €1,075 million in 2019, up 2%. Including the temporary vitamin effect, this is a decrease of 20%.
Net sales | Adjusted EBITDA | ||||||
x € million | 2019 | 2018 | % change | 20191 | 2018 | % change | |
DSM underlying business | 9,010 | 8,8522 | 2% | 1,684 | 1,5322 | 10% | |
DSM | 9,010 | 9,267 | -3% | 1,684 | 1,822 | -8% | |
Nutrition underlying business | 6,028 | 5,7222 | 5% | 1,250 | 1,1172 | 12% | |
Nutrition | 6,028 | 6,137 | -2% | 1,250 | 1,407 | -11% | |
Materials | 2,746 | 2,913 | -6% | 509 | 512 | -1% | |
Innovation Center | 194 | 172 | 13% | 22 | 8 | 175% | |
Corporate Activities | 42 | 45 | -7% | (97) | (105) | -8% | |
- Including the impact of IFRS 16, see table Impact of IFRS 16.
- Excluding temporary vitamin effect in 2018 of €415 million sales and €290 million (Adjusted) EBITDA, for further information see table Temporary vitamin effect 2018.
Net profit
Adjusted net profit of €830 million was up versus the underlying business in 2018. Net profit attributable to equity holders of DSM decreased by €319 million to €758 million. This decrease was mainly a result of the higher Adjusted underlying EBITDA (up €152 million, including €52 million attributable to the IFRS 16 effect), the temporary vitamin effect of €290 million in 2018, and the gain of €109 million on the disposal of our 50% share in DSM Sinochem Pharmaceuticals in 2018. Expressed per ordinary share, net earnings amounted to €4.27 in 2019 (2018: €6.10).
Financial income and expense decreased by €9 million year on year to €92 million. This was mainly caused by positive results on derivatives.
The reported effective tax rate over Adjusted taxable result 2019 was 18.2% (2018: 17.4%). This increase was mainly caused by the impact of increased tax rates.
Adjustments made in arriving at DSM's Alternative performance measures (APM adjustments)
Total APM adjustments for the full year amounted to a loss of €66 million (2018: profit of €45 million), consisting of a loss in EBITDA of €98 million (including restructuring costs of €68 million), impairments of €23 million, a related tax benefit of €27 million and a profit of €28 million relating to associates and joint ventures (mainly related to the step-up to the fair value of Andre Pectin prior to the acquisition).
Net sales by destination
in %
Net sales by business segment
in %
Net sales by origin
in %
Net sales by end-use market
in %
Adjusted EBITDA margin
in %
Cash flow statement
x € million | 20191 | 2018 |
Cash and cash equivalents at 1 January | 1,281 | 899 |
Cash flow provided by operating activities | 1,385 | 1,391 |
Cash from / (used in) investing activities | (525) | (605) |
Cash from / (used in) financing activities | (1,332) | (401) |
Effect of exchange differences | (9) | (3) |
Cash and cash equivalents at 31 December | 800 | 1,281 |
- Including the impact of IFRS 16, see table Impact of IFRS 16.
Cash flow of €1,385 million provided by operating activities mainly consists of the EBITDA for the year (€1,586 million) less various cash-out items including income tax of €140 million and defined benefit plans of €39 million. Our focus on cash flow resulted in a full-year operating cash flow of €1,385 million, similar to the level of 2018, which was driven by the one-time vitamin effect in that year. Excluding this 2018 effect, the cash from operating activities increased by €259 million, or 23%, mainly due to the increase in the underlying EBITDA. See also 'Consolidated financial statements'.
The cash used in investing activities included capital expenditure (€627 million) and acquisitions (€556 million), partly offset by the decrese in fixed-term deposits (€588 million).
The cash used in financing activities consisted mainly of the repayment of the corporate bond (€300 million), dividend paid (€291 million) and the repurchase of shares (€869 million).
For the full cash flow statement, see Note 26 'Notes to the cash flow statement'.
Balance sheet
The balance sheet total (total assets) reached €13.4 billion at year-end (2018: €13.6 billion). Equity was rather stable, with an increase of €20 million compared to the position at the end of 2018. The net result and reissue of shares more or less balanced out with the dividend and repurchase of shares. Equity as a percentage of total assets increased from 57% to 58%.
Compared to year-end 2018, net debt increased by €1,031 million to €1,144 million. The gearing at year-end was 12.7%, an increase compared to 1.4% at year-end 2018.
Capital expenditure on intangible assets and property, plant and equipment amounted to €623 million in 2019 (€609 million on a cash basis), which was in line with the level of amortization and depreciation.
Total working capital amounted to €1,852 million compared to €1,674 million at year-end 2018. This represents 21.5% as a percentage of annualized fourth quarter 2019 sales (2018: 19.0%), which is above our aspiration of 20%. Cash-wise, the operating working capital (OWC) decreased by €52 million, mainly due to lower cash-out for inventories. The OWC percentage increased from 24.2% at year-end 2018 to 26.3% of annualized sales at year-end 2019.
Cash and cash equivalents came to €800 million at the end of the year; including current investments, this amounted to €1,488 million (2018: €2,558 million). Besides the regular cash flow elements, this decrease was mainly due to acquisitions (€556 million), the repayment of the bond (€300 million) and the repurchase of shares (€869 million).
Balance sheet profile
20191 | 2018 | |||
x € million | in % | x € million | in % | |
Intangible assets | 3,515 | 26 | 3,090 | 23 |
Property, plant and equipment | 4,040 | 30 | 3,511 | 26 |
Other non-current assets | 664 | 5 | 730 | 5 |
Cash and cash equivalents | 800 | 6 | 1,281 | 9 |
Other current assets | 4,424 | 33 | 5,029 | 37 |
Total assets | 13,443 | 100 | 13,641 | 100 |
Equity | 7,835 | 58 | 7,815 | 57 |
Provisions | 168 | 1 | 153 | 1 |
Other non-current liabilities | 3,325 | 25 | 3,139 | 23 |
Other current liabilities | 2,115 | 16 | 2,534 | 19 |
Total equity and liabilities | 13,443 | 100 | 13,641 | 100 |
- Including the impact of IFRS 16, see table Impact of IFRS 16.
| “ | We delivered a good financial performance and achieved key milestones in the first year of Strategy 2021. We are focused on growth, costs and operational excellence initiatives across the company to offset a challenging macroeconomic environment. ” |
Geraldine Matchett, Co-CEO |
Outlook 2020
DSM expects to deliver a mid-single digit increase in Adjusted EBITDA for 2020 compared to prior year, together with an improvement in Adjusted net operating free cash flow in line with our Strategy 2021 targets. This outlook is driven by DSM's own growth initiatives, innovation programs and self-help actions, and does not assume any significant improvement to the current macroeconomic environment. With regard to any potential impact of the Coronavirus, DSM will monitor the situation closely.